Service Areas on the GPU and in the Browser, Checked Against ArcGIS
I have used ArcGIS Network Analyst for service areas for a long time. You give it a start point and a few drive times, and it gives you the streets and the area that you can reach. It is correct, and it is the reference that people trust. But it is not fast. For 100 crash locations in Adams County, Ohio, with breaks of 1, 5 and 10 minutes, the solve takes 69 seconds. For all 2,483 crashes, it takes 31 minutes.
So I asked a simple question: can a GPU calculate the same service areas, and I mean the same, not "close enough"? And if the GPU can do it, can the browser do it too? In this post, I show the three engines that I built, how I compare them with ArcGIS, and where they do not agree. The source is on GitHub: mraad/service-area.
The problem
The study area is Adams County, Ohio. The data is a file geodatabase with 3,063 street lines and 2,483 crash points. The start points are the crashes. The question for each crash is: which streets, and which area, can you reach from it in 1, 5 and 10 minutes?
The street data has no speed field and no one-way field. Each street gets a speed from its road class (the Census MTFCC code), and the travel time in minutes comes from that speed. One Python file holds this table, and every engine uses it. If two engines use different costs, a comparison between them means nothing.
Three engines, one network
- ArcGIS engine. ArcPy and Network Analyst on Windows with ArcGIS Pro 3.7. It writes the reference lines, the polygons and the facility locations. I use the Network Analyst layer API, because the newer
arcpy.naxAPI fails on this network dataset (no travel modes). - CUDA engine. Python and CuPy on Linux with an NVIDIA RTX PRO 6000 Blackwell. A
RawKernelcalculates the shortest paths. Each crash gets one thread block. The arithmetic is float64, and the kernel stops a path when it passes the largest break. - Browser engine. JavaScript in the ArcGIS Maps SDK for JavaScript. It has a Float64 Dijkstra, a WebGPU version, a WebGL2 layer that draws the area, and GEOS in WebAssembly that makes the real polygon.
All three read the same street table. The ArcGIS prep step makes it: filter by road class, planarize, integrate at the network XY tolerance, and drop duplicate streets. The CUDA engine and the browser read the result as Parquet. If the network is different, the engines are different, and no tolerance fixes that.
What "the same" means
This was the hard part. A service area has two outputs, and I check each one in a different way.
Lines. ArcGIS gives the reached part of each street, cut at the break. The CUDA engine gives the same thing as intervals along each street: reached from the start node, reached from the end node, or reached on the crash's own street. The gate is exact. The cumulative minutes must agree within 1e-6 minutes, and the cut positions must agree within 1e-6 of the street length.
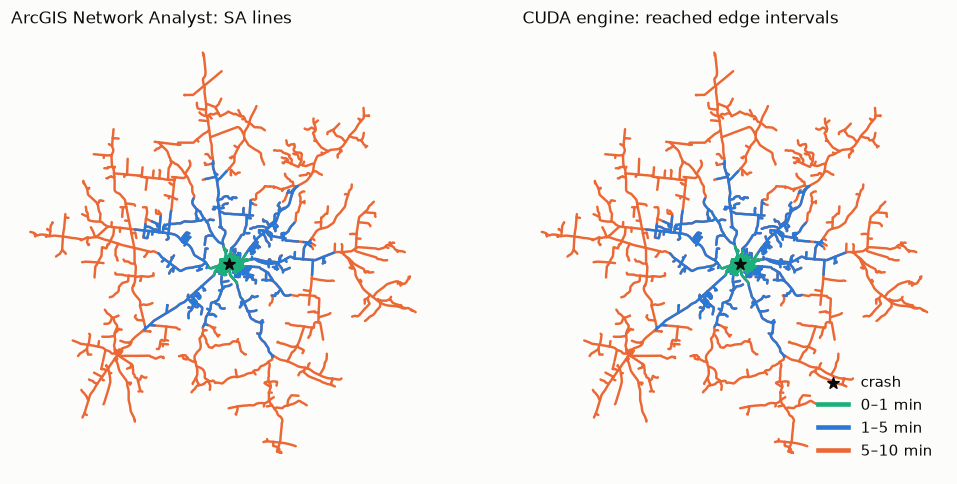
The result on the 100-crash sample: 0 cost mismatches in 84,676 lines. The largest difference is 1.8e-15 minutes. That is float64 noise. There is 1 interval mismatch in 97,362 interval sets. I will come back to that one.
Polygons. Here I cannot be exact. Esri generalizes its polygons, and I cannot reproduce that step. So the gate uses one polygon builder for both sides. The builder takes the ArcGIS lines and makes a polygon, and it takes the CUDA lines and makes a polygon. Then I compare the two polygons: IoU 0.99 or more, and Hausdorff distance 50 ft or less. The native ArcGIS polygons are a reference only, and I report how far they are from mine.
The builder works like this. It buffers each reached street piece by 100 m with flat ends, because ArcGIS also cuts flat at the break. It adds a disk at junctions where all the streets are reached. It fills a city block when all the streets around it are reached. Then it keeps only the ground whose nearest street is reached. That last step came from Franklin County (Columbus). There, many unreached streets run next to freeways, and a buffer along the freeway covered them. ArcGIS does not include that ground. To find the nearest street, the builder cuts each street into 50 ft pieces and makes a Voronoi cell for each piece.
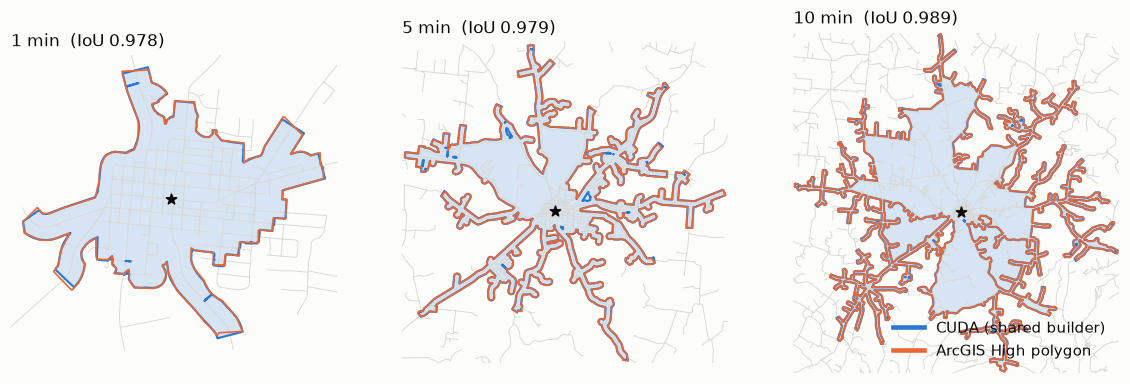
With the shared builder, 299 of 300 polygons pass the gate. Against the native ArcGIS polygons, the median IoU is 0.962 at 1 minute, 0.975 at 5 minutes and 0.986 at 10 minutes. The nearest-street step raised the Franklin pilot from 0.86 / 0.93 / 0.95 to 0.97 for all three breaks.
The one mismatch
Crash 1800, at 5 minutes. My first guess was a bug in my kernel. Then I suspected dirty geometry, so I ran the OGC geometry check on the source streets. It found 0 problems in Adams and in Franklin. The real cause is on the ArcGIS side. For this crash, ArcGIS does not split one street at the 5-minute break. For another crash, it splits the same street correctly. The Franklin pilot shows the same behavior on 2 lines. My gate labels this case, but it still counts it as a failure. I did not widen a tolerance to make it go away, because that would also hide a real bug.
Speed
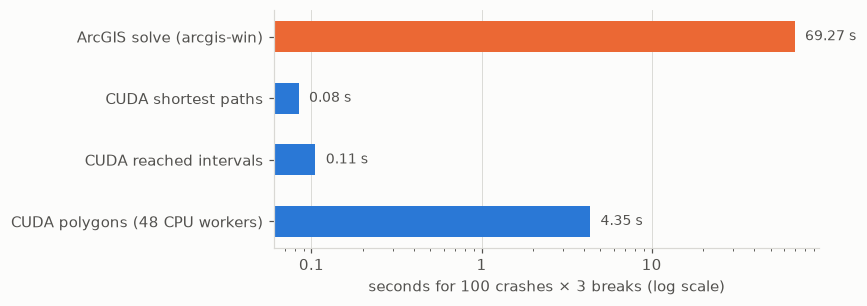
Now the best part. For the same 100 crashes and 3 breaks:
| Stage | Time |
|---|---|
| ArcGIS solve | 69.3 s |
| CUDA shortest paths | 0.08 s |
| CUDA reached intervals | 0.11 s |
| Polygons (shapely and GEOS, 48 CPU processes) | 4.35 s |
The shortest paths are not the problem anymore. The polygons are. They run on the CPU, and the nearest-street step doubled their time (from 2.41 s to 4.35 s). I accept that cost, because fidelity comes first and speed comes second.
The same engine runs as a live FastAPI server. One request is one crash and one break. The server time at the median is 3.7 ms for 1 minute, 18.9 ms for 5 minutes and 67.6 ms for 10 minutes. I also ran everything on an NVIDIA GB10 (aarch64, 121 GB unified memory). The outputs are equal bit for bit, and the polygons are faster there, because its CPU cores are faster.
In the browser
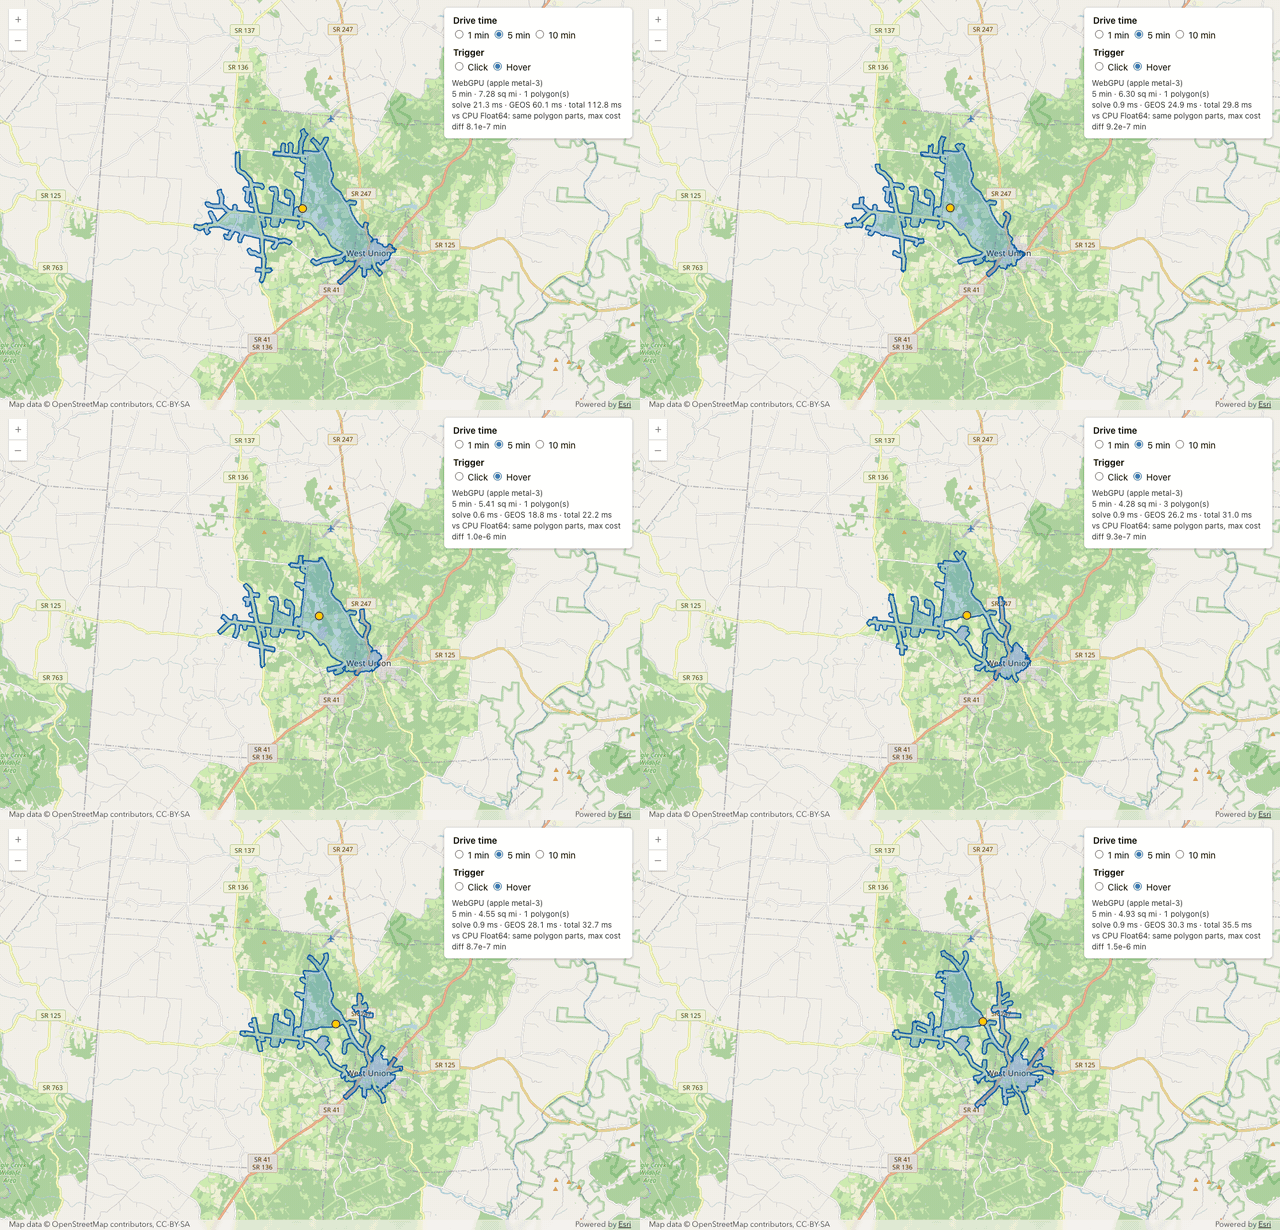
The browser engine does not need the server. It loads one binary file (24 MB) with the street graph, the snap geometry and a static mesh. It snaps the mouse position to the nearest street, and runs a Float64 Dijkstra. A 10-minute solve takes about 0.03 ms in Node. A WebGL2 layer draws the area: rasterization does the union of the buffers, and the depth buffer finds the nearest street of each pixel. GEOS in WebAssembly makes the real polygon with the same rules. Against the server polygon, the browser polygon passes the gate for 300 of 300 crash-breaks.
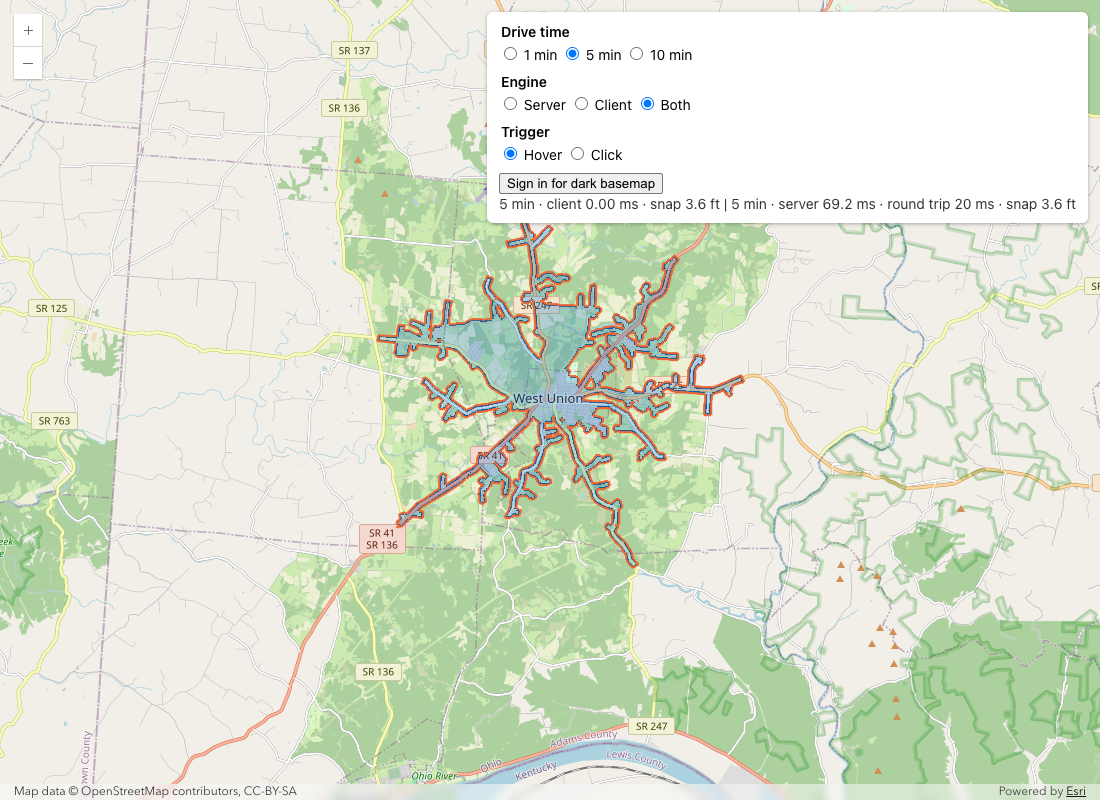
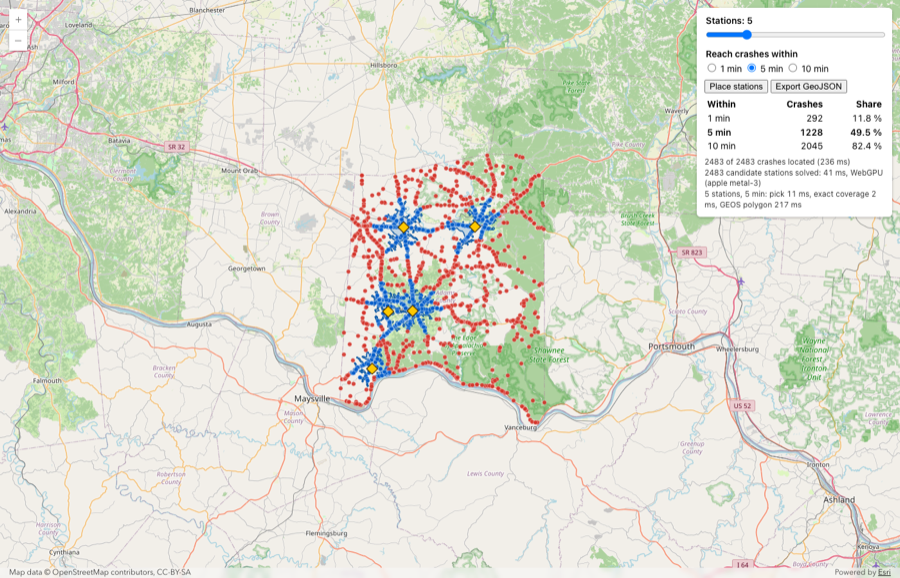
And guess what? When the browser is fast, you can ask a different question. The planner page solves all 2,483 crashes as candidate stations with WebGPU in about 40 ms. Then it picks the stations that reach the most crashes. Five stations reach 1,228 crashes (49.5%) in 5 minutes.
What this does not show
- Adams County is a small rural network (5,035 edges). Franklin County has a pilot of 20 crashes only.
- The speeds come from the road class. There are no posted speeds, no one-way streets and no traffic.
- The polygon match with native ArcGIS is close, but it is not exact. The gate uses my builder on both sides.
- The polygons run on the CPU. They are now the slowest step.
Try it
The repository has the Adams County test data: the prepared streets, the crashes, and the ArcGIS output for the 100-crash sample. With these files, you can run the CUDA engine and the parity gate without an ArcGIS licence. The README has the rules, the measured results and the procedures.
Next, I want to move the polygon step to the GPU, and I want to run the 2,000-crash check on Franklin County. More to come.


Comments