Posts

Showing posts from August, 2008

Heat Map + Papervision3D

Image
Doug McCune (one of my all time Flex heroes) contributed heavily to SpatialKey , which looks and works great. Got to see it last week at 360|Flex in San Jose. I've been wanting to do something similar, but in 3D! Dabbled a bit with Papervision3D , but wanted to get into it, and that was the perfect opportunity. The idea that I had was to read a country shapefile , and thematically map all the cities in that country based on some attribute. And do all that on the client using Flex. I did a little bit of research, and here is a list of sites that "inspired" me: http://blog.papervision3d.org/ http://code.google.com/p/vanrijkom-flashlibs/ http://www.darronschall.com/weblog/archives/000273.cfm http://www.seld.be/ http://blog.zupko.info/?p=150 And here is a snapshot of the result: You can download the source code of the application from here . And you can see a sample demo here .
Quantile Thematic Mapping

Image
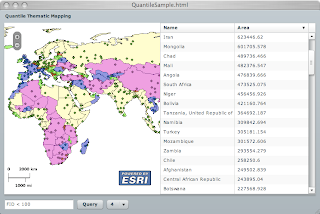
In a previous post, I showed how to bind the output of a query task to a graphic layer. The graphic layer had a default symbol that was used to render the graphic features. In the following example, I would like to symbolize each feature based on an attribute value. We could use the symbolFunction property of a graphic layer, however this function is called on each graphic feature and does not have a "grand picture" of the full set. This is the case of a quantile distribution, where the features are rank-ordered and equal number of features are placed in colored bucket. Here is the result: Each country is color coded based on a quantile distribution of its area property over a specified number of classes. Here is the code: <?xml version="1.0" encoding="utf-8"?> <mx:Application xmlns:mx="http://www.adobe.com/2006/mxml" xmlns:esri="http://www.esri.com/2008/ags" xmlns:sample="com.esri.ags.sample.*" layout="abs...

3D Multinodal Routing Application

Was tasked to build a Flex based 3D multi-nodal routing application for ESRI's International User Conference. Check out it here . The application enables the user to select a starting and ending room, then an optimized route is calculated using an ArcGIS GeoProcess task. The returned features are rendered in 3D and symbolized based on the floor level and the transition type, such as escalator, stairs or elevator. The floor and room outlines are derived from embedded shapefiles . I used Papervision3D for the the 3D rendering. Though this was my first time dabbling with Papervision, the learning curve was easy and having access to the source code made it more approachable.

360|Flex

Just got approved to be there . Hope to connect with some of you guys !

Poor Man's Tracking

Short of using BlazeDS for asynchronous event notification, RSS is nice "standard" way to publish events. And since XML is a first class citizen in AS3, then parsing the feed is relatively easy. Yes, sure, I can use this syndication library, but it does not give me the control that I need over the feed items, specially over custom tags. One of these custom tags refer to GeoRSS , where you can add a geographical reference to the RSS entries. The geo tags can be of the form of points, lines or polygons. Here is a sample of a GeoRSS feed in JSP, where on every request a random lat/lon point value is generated. This can easily be extended to get the values from a database or a GPS source: <%@ page contentType="text/xml" language="java" %> <% final double lat = -45.0 + 50.0 * Math.random(); final double lon = -45.0 + 50.0 * Math.random(); %> <feed xmlns="http://www.w3.org/2005/Atom" xmlns:georss="http://www.georss.org/georss...

Callout Marker Symbol

Image
Point locations in the new Flex API for AGS are rendered using a Symbol subclass. One of these classes is the InfoSymbol, where an info window (callout) will be displayed anchored at the point location. Developers can specify the content of the symbol as a DisplayObject sublcass. The InfoSymbol was inspired from the FIG: Callout Component . Below is a sample. Click on it to see it in action, and you can download the source code from here .

Flex API For ArcGIS Server in action

This is one of my favorite usage of the API in pure MXML. I'm taking advantage of data binding to represent the output of a Query Task in graphical and textural format. In this application, I've created a QueryTask to a specific layer (countries) in an ArcGIS service (world). The QueryTask has a Query child specifying that the geomerty of the features should be returned, in addition to all the attribute fields. The application UI consists of a side by side map and data grid, and below those is a text field to define a "where" clause, and a button to execute the query. The map has two layers, a dynamic layer to show the world and a graphic layer to show the selected countries. When a user clicks the Query button, the Query "where" attribute is populated (via binding) with the textfield content and the QueryTask is executed. Upon a successful result, the graphic layer will be populated with new graphic objects and the data grid will contain new rows. The bin...

Flex API For ArcGIS Server

Ok gang, sorry for the long silence. We have been busy here @ ESRI with building the Flex API for ArcGIS Server . We will be announcing the public beta at the user conference this week and here is the link. Download it, try it out and give us some feedbacks.