Wednesday, May 25, 2016

Snapping Points To Lines And ArcGIS Pro

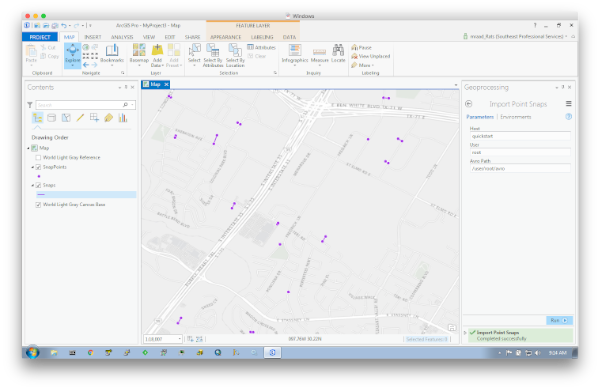
Been wanting to post on this subject for quite some time (actually over a year) as associating a world coordinate with the proper nearby linear feature provides tremendous insight based on the fusion of their attributes. Moreover, doing that on a massive scale and quickly is even more imperative in today's BigData world, thus the usage of Apache Spark. I’ve posted a standalone implementation that relies on well-documented simple math and published methodology to perform searches on massive datasets in batch mode. What is exciting to me in writing this post was the viewing of the snap results in ArcGIS Pro. My lack of knowledge in extending ArcGIS Pro with downloadable Python modules contributed to the delay (and slight case of procrastination :-). However, with the help of a colleague, I was able to pip install modules that can be imported by my custom ArcPy based toolboxes without any errors.

img-alternative-text

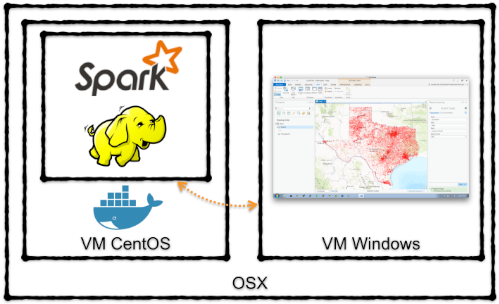
Also, since this is all based on BigData, well it has to be tested in a BigData environment. The post describes the usage of Docker and the Cloudera QuickStart container to check the snap and the visualization. The following illustrates my development environment.

img-alternative-text

Like usual, all the source code can be found here.

Sunday, April 10, 2016

Vector Tiles: The Third Wave

When it comes to web mapping, we are surfing on a third wave in our digital ocean. And the “collaborative processing” between the digital entities while surfing that wave is making the ride more fun, insightful and expressive.

The first web wave was back in the mid 1990s, where interactive maps in the form of html image tags relied heavily on the server and requests parameters to regenerate the image when you clicked on the edge arrows to pan and zoom. Remember MapQuest and ArcIMS ?

Then in the mid 2000s came the second wave or more like a tsunami, Google Maps. You hold down the right mouse button on the map and drag to pan, you use the scroll wheel to zoom in and out, and… when you click on the map, a bubble appears on the map showing the details of the clicked location. Disruptive ! And all was smooth, responsive and AJAXy. This is when I believe that this collaborative processing concept took root and materialized itself in the web mappers’ minds. Soon after, more expressiveness was required as HTML was lacking in power and functionalities and the capitalization on browser plugins emerged to create Single Page Applications. Remember Flex and Silverlight ?

We are now in the mid 2010s. Flash is dead because he ate an “Apple”. HTML5, CSS3 and Javascript are in full swing and though Tile Services are fast as the tile images are preprocessed and prepared to be displayed, they are still image based, and dynamic styling of the features in a tile is not easy. In addition, with the ubiquity of GPUs on edge devices, faster rendering for expressiveness is now possible through the elusive “collaborative processing”.

Enter Vector Tiles. Map box has defined a vector tile specification that we at Esri have adopted it in our Javascript API, and demonstrated its versatility at the 2015 User Conference. Andrew Turner has a nice writeup about it. And found this nice in-depth paper that analyses the dynamic rendering of vector-based maps with WebGL.

I wanted to know more about it and I learn by doing. So I implemented two projects, a Mapbox Vector Tile encoder and a visualizer as heuristic experiments to be used with the Esri Javascript API. Again, these are experiments and will report on more updates.

Tuesday, March 15, 2016

ArcGIS For Server On Docker

“But…It works on _my_ machine !!!” How many times did you hear that ? That is exactly one of the use cases of Docker for developers - Create an exact reproducible environment for each developer, even down to the hardware specification. And, that same environment can be on premise or in the cloud.
With the advent of ArcGIS For Server 10.4, I wanted to run it on my mac so I can try out some of the new features like chaining multiple SOIs.
I could have started a Windows based VM and gone through the GUI based setup, which is a pretty straight forward process (My friend Georges G. calls this, a PhD process, Push Here Dummy). But, I wanted to automate the whole install process in a headless way (I’m sure there is a way to do that using Windows, just I do not know how, maybe a blog post for another day)
Enter Docker. After downloading the ArcGIS For Linux tarball and the license file from my.esri.com, you can build a Dockerfile that automates the whole install process in a headless way - DevOps love this - In addition, once a build is done, you can run the image on premise or in the cloud by referencing a docker-machine.
Like usual, you can check out the whole source code on how you can do this here.

Monday, February 8, 2016

(Web)Mapping Elephants with Sparks

CSV files (though not the most efficient format and least expressive due to meager header metadata) is one of the most ubiquitous formats to place data in BigData stores like HDFS. In addition, geospatial information such as latitude and longitude is now the norm as fields in those CSV files origination from say a moving GPS based device.
A constant request that I receive all the time is “How do I visualize on the web all these data points?” There is a legitimate concern in this question which is “How do I visualize on the web millions and millions on points?”. Well the short answer is “You Don’t!” (actually, you can…but that is blog post for another day). Though you can download a couple of million points to a web client, after a while the transfer time will be prohibitive. However, if you process the data on the server and send down the aggregated information to be symbolized on the client, then things become more interesting.
A common aggregation processing is binning, where, imagine you have a virtual fishnet and you cast that fishnet on your point space. All the points that are in the same fishnet cell are collapsed together to be represented by that cell. What you return now are the cells and their associated aggregates.

This
project is a collection of Python tools using the ArcGIS System that retrieves CSV data with geospatial fields from HDFS and displays the aggregation in the form of hexagonal areas using ArcGIS online web maps and web apps. The processing is done in Python using Apache Spark.

The ArcGIS System is a sequential composition of:

  • Desktop with Python based GeoProcessing extensions for authoring.
  • Server with GeoProcessing endpoints for publishing.
  • Online with WebMaps and WebApps built using AppBuilder for presenting.

Like usual, all the source code is here.

Saturday, January 30, 2016

DBSCAN on Spark

The applications of DBSCAN clustering straddle various domains including machine learning, anomaly detection and feature learning. But my favorite part about it, is that you do not have to specify apriori the number of clusters to classify the input data. You specify a neighborhood distance and the minimum numbers of points to form a cluster and it will return back a set of clusters with the associated points in the cluster that meet the input parameters.
However, DBSCAN can consume a lot of memory when the input is very large. And since I do BigData, my data inputs will overwhelm my MacBook Pro very quickly. Since I know Hadoop MapReduce fairly well, and MR has been around for quite some time, I decided to see how other folks implemented such a solution in a distributed share nothing environment. I came across this paper, which was very inspiring and found out that IrvingC used it too as a reference implementation. So I decided to implement my own DBSCAN on Spark as a way to further my education in Scala. And boy did I learn a lot when it comes to immutable data structures, type aliasing and collection folding. BTW, I highly recommend the Twitter Scala School.
Like usual, all the source code can be found here, and make sure to check out the “How It Works?” section.

[Update] After posting - I saw this post - very nice video too!

Monday, January 4, 2016

Spark Library To Read File Geodatabase

Happy 2016 all. Yes it has been a while and thanks for your patience. Like usual, at the beginning of every year, there are the promises to eat less, exercise more, climb Ventoux and blog more. Was listening to Feakonomic (When Willpower Isn’t Enough), and this initial post of the year is to harness the power of a fresh start.

Esri has been advocating for a while to use FileGeodatabase, and actually released a C++ based API to perform read-only operations on it. However, the read has to be performed off a local file system and the read is single threaded (you could write an abstract layer on top of the API to perform a parallel partitioned read if you have the time).

In my BigData uses cases, I need to place the GDB files in HDFS so I can perform Spark based GeoAnalytics. Well, that made the usage of the C++ API difficult (as it is not using the Hadoop File System API) and will have to map the Spark API to a native API and will have to publish the DLL and…(well you can imagine the pain) - I attempted this in my Ibn Battuta Project where I relied on the GeoTools implementation of the FileGeodatabase, but was not too happy with it.

I asked the core team if they will have a pure Java implementation of the API, but they told me it was low on their list of priorities. Googling around, I found somebody that published a reversed engineered specification. My co-worker Danny H. took an initial stab at the implementation and over the holidays, I took over targeting the Spark API and the DataFrames API. The implementation will enable me to do something like:

sc.gdbFile("hdfs:///data/Test.gdb", "Points", numPartitions = 2).map(row => {  row.getAs[Geometry](row.fieldIndex("Shape")).buffer(1)}).foreach(println)

and in SQL:

val df = sqlContext.read.
format("com.esri.gdb").
option("path", "hdfs:///data/Test.gdb").
option("name", "Lines").
option("numPartitions", "2").
load()
df.registerTempTable("lines")
sqlContext.sql("select * from lines").show()

Pretty cool, no ? Like usual all the source code can be found here.