Posts

Showing posts from 2010

AS3 Socket Issues With Large Data on MacOS

So... I was writing an MXML/AS3 application that uses a Socket class instance to consume large amounts of data from a Java socket server program. The server is supposed to write very rapidly 1MB data chucks to a connected AS3 client. Now the funny part is that when the packet size is less that 64K, the server would write these packets very quickly, but when it was writing 1MB chucks, it would "stall" between writes while the client was reading the data in 64KB chuncks. So, I start pulling my old TCP tuning trick back from my 'C' days to tune the socket server. But no difference. I can only tune the server side as the client AS3 socket class does not offer any tuning properties and I'm assuming that the folks at Adobe would implement sockets correctly. It is this last statement that kept nagging me. "How often have I said to you that when you have eliminated the impossible, whatever remains, however improbable, must be the truth?" (Sherlock Holmes). So...

How to use Esri Flex API on Android and iPhone

Image
Update (Jun 2011) : For more updated info, check out my ADC article here . At MAX2010 (Awesome BTW) Adobe introduced Flex SDK Hero and Flash Builder Burrito which enables you to build and deploy Flex mobile applications on Android by default. In addition, using the revitalized Packager for iPhone , you can postprocess the swf into an ipa that you can deploy on an iPhone using iTunes. In this post, I will share with you the steps that I took to use the Flex API for ArcGIS to build a mobile mapping application. First and foremost - RTFM - here are some links that u _need_ to read specially for iPhone provisioning: http://opensource.adobe.com/wiki/display/flexsdk/Hero http://labs.adobe.com/technologies/flashbuilder_burrito/ http://labs.adobe.com/technologies/packagerforiphone/ The cool part of this whole process is now you have one code base to build upon and deploy on Android and iPhone and in the future whatever mobile platform Adobe decides to support. You can download ...

Dynamic Legend Generation From An Image Map Services

You can see the national weather warnings that NOAA publishes here . If you look at the page, you will notice that _all_ the legend swatches and text are presented under the map and you are left to your own means of locating the associated colors between the map and the legend grid to figure out what is on the map. It would be nice if the legend grid could be dynamically generated to list only the swatch colors and their descriptions based on what is on the map. This is what this post tries to solve. So NOAA publishes the national weather service maps as Esri ArcGIS REST endpoints . Using an instance of an ArcGISDynamicMapServiceLayer subclass, I can intercept the reponse image. Once I have the image bitmap data, I can get a histogram of the color distribution. Now using NOAA color map , I can associate a color with a description and populate a legend UI component. Check out the application in action here . The legend located on the top right corner is not fully transparent, roll the m...

Image Flare Symbol For Clustered Graphics

This is a long overdue post following the clustering post where I wanted each flare element in a cluster symbol to flare to a different image symbol when the flare expands out. In addition, the default flare symbol expands upon a rollover mouse event, by me giving you the source code, you can customize it to expand on click, double click, shift click, whatever you want - you have the source code. The same applies to the flare elements. The ImageFlareSymbol has the same properties as the basic FlareSymbol but has two additional properties (backgroundWeights, backgroundColors) to color code the clusters based on their weight value. Each cluster is composed of one or more Graphic instance. In this implementation, each graphic must be symbolized with an instance of ImageFlareElementSymbol. The latter has a property ‘href’ that reference a bitmap url that will be displayed as a flare element. Here is a sample application to show the image flare in action. And like usual, here is the sou...

Weighted Map Feature Clustering With Attributes

Image
Was asked if the WeightedClusterer can cluster features not just by proximity but by proximity and attribute property value. The idea is that there should be at least one cluster per unique attribute property value. Let me explain further:  The above snapshot is a clustering of cities based on proximity and country - note that despite the proximity of Belgium and The Netherlands, two distinct clusters have been created one for BE and the other for NL - now for France - there is a cluster containing one feature over Paris, however due to the distance from Paris (at that scale) a cluster was created based on 3 cities in the south of France. Make sense ? In the implementation of the AttrClusterer class that extends the ESRIClusterer class, we override the clusterGraphics function. This function is invoked indirectly by the Flex framework during the update of the display list. In this function, we overlay a virtual grid on the map. This grid acts as a spatial index. Features that are ...

Merging Table Of Content and Legend Info

Initially, while working on Gulf Of Mexico Response Map , the legend and table-of-content were two separate windows. That took too much real-estate, and a TOC layer was hard to correlate with the legend swatch by name only. So I set upon merging the legend window and the table-of-content into one window. There is plenty of TOC code as a visual tree component, but it is the legend UI that causes us trouble as there is no REST endpoint to get the layer swatch information. Well with the advent of FeatureLayer somebody can argue that this could be done. But you still have to go back and forth for each layer and get the rendering information. BTW, this will be remedied in 10.1, as a new REST endpoint will be introduced to get _all_ rendering information of a map service. In the meantime, I had to do something. As you can imagine the project map services were very dynamic and the layer content was changing constantly, so having a static legend is out of the question. There were attempt...

Pixel Bender For Map Projection

A customer came up to me at the User Conference and asked me if I can apply the same overlay method that I used in my OverlaySymbol application to position a geographic referenced image on a web mercator tiled base map; since esri is migrating most of its published maps on arcgis.com to web mercator. After talking it over with my friend Kerry (who is the final authority when it comes to map projections), he recommended that this should be a pixel by pixel operation due to the exponential latitude elongation nature of web mercator. So basically the algorithm is; for each output mercator pixel, convert it back to geographic, find out in the geographic image source what is the pixel color at that geographic location and assign that color to the output mercator pixel. Straight forward, I mean the web mercator transform is well known. I just have to do it a million time, and... that is when I started panicking. A million time loop in AS3 - that will take forever (well actually half a se...

Augmented Reality, iPhone and ArcGIS Server

Image
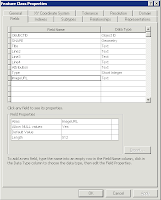
I am a HUGE fan of Augmented Reality , and one of my favorite applications on the iPhone is Layar . In this post, I will "walk you" through how to setup a simple ArcGIS Layar Point Of Interests (POI) layer and how to expose it through the iPhone application. In addition, I created a small Flex application that will enable you to add POIs to that feature class through a python geo-processor task. BTW - this is heavily geared to using ESRI desktop and server tools and I'm assuming that you are familiar with these tools. First, request a developer key from http://dev.layar.com/ . This might take a couple of hours to get to you. So, in the meantime, let's get started. Using ArcCatalog, create a new point feature class called 'Layar' in a geodatabase with the following fields: Title (text), Line2 (Text), Line3 (Text), Line4 (Text), Attribution (Text), Type (Integer), ImageUrl (Text:512). Import that layer into a map document using ArcMap. Save and publish the ...

Heat Map Layer Revisited

Image
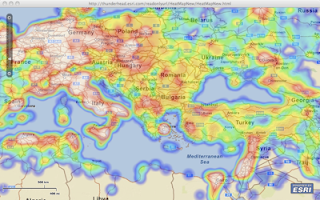
Following this post, Glenn G. found an "issue" when panning the map. I revisited the project and indeed there was a bug. Thanks Glenn. I updated the project and here is the result. In this project, I downloaded from geonames all cities with population over 15000 and plotted them on the map. The clustering of the cities (over 21,000) generated a cool heat map. Check it out and tell me what you think. And like usual, you can download the source code from here .

How Oracle Can Improve Java

Found this great article "15 Ways Oracle Can Make Java Better (and Improve Its Stance with Developers)" - here is my "in the weed" take: Keep JavaONE - with heavy focus on developers. Embrace OSGi down in the core VM. Kill JavaFx - Work closer with Adobe on Flex / BlazeDS / LCDS . Improve Dynamic Language Support - groovy / scala / JRuby / Jython /etc... Talk to Google about ME (seriously?) / Android Kill NetBeans - Eclipse may be King, but IntelliJ is God ! Introduce new language primitives XML / Function / JSON. Improve language - set/get bean, native String ( switch myString {case "foo": ...}) as for casting. LINQ for Java - LCDS can help here. Talk to the Spring folks - there-is-only-one-framework-zuul :-) No "Effing" store ! So....what do you think ?