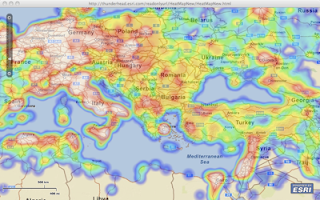
 Following this post, Glenn G. found an "issue" when panning the map. I revisited the project and indeed there was a bug. Thanks Glenn. I updated the project and here is the result. In this project, I downloaded from geonames all cities with population over 15000 and plotted them on the map. The clustering of the cities (over 21,000) generated a cool heat map. Check it out and tell me what you think. And like usual, you can download the source code from here.
16 comments:
No, thank YOU, Mansour. The new layer works swimmingly!
Looks great Mansour.
http://stackoverflow.com/questions/2333395/arcgis-server-heatmap-for-to-identify-hotspots-on-a-cached-service
Mansour,
I am using Michael VanDaniker heat map component in a project I am using Modest Maps and I have the same issue.
Can you point me to where in the code you found the bug?
Thanks.
Bug was in _my_ code when I extended Layer.
wow. that seems like alot of points... this is getting generated on the fly.. so I wonder what I can do with heat maps... and when it makes sense to use them... it's a spatial cluster or is it based on a value?
Well - u can load ur own data - it is both a clusterer and it color codes based on the point "weight" - pretty cool eh ?
So Mansour... when are we getting that utils class of yours that I spotted during the devsummit... ;)
Sorry for the delay - u can download it from http://thunderhead.esri.com/readonlyurl/flexapiutils.swc - hope this helps
Great work Mansour,
Is there anyway to modify this code to make it work more like a spatial analysist countouring rountine (IDW or kriging)? I tried to modify the code, but my matrix knowledge is poor. So instead of this clustering effect that changes with zoom, i would want a static gradient graphic that is the contours or interpolation between the points values (or weights as you have it). Would this be easy to do - would be incredibly helpful and powerful. Essentially spatial analysit, client-side!!
Interesting - let me see what I can do :-)
I did 'massage' your code a bit to basically do a version of inverse distance weighting interpolation. It sort of works, but many minor rendering issues - still working on it. I get lost in the matrix and graphics code :) Let me know if you want me to send what i did so far. Pretty cool though, gives you spatial analyst capabilities, client-side! Thanks!
Hi Mansour,
Firstly, thanks a lot for your excellent work. The example looks fantastic.
What I would like to do is plug in my own data however instead of having all points with equal weight of 1 I would like to use the weight attribute for say error %. Areas of high % error would then be red etc. Can you advise how I might achive this?
Thanks a lot
hi Thunderhead,
I saw your heat map example it is nice one and I found that it has a lot of potential for piloting of point data over the map.
But I am looking for the same rendering style on the basis of point attribute value I saw your clustering of point eg. but I dint no how I implement for heat map. I go through your heat map code nicely but I dint get any clue to cluster point on the basis of certain value. actually I want to cluster the point in some class interval...plz reply I need urgently...
Does http://thunderheadxpler.blogspot.com/2010/08/weighted-clustering-with-attributes.html helps ?
thanks for post.. works great based on location but seems does not work based on attribute in my case. please advise.
i dont have time based data. but i have few layers (6) to store the % of some info. when i move slider, it does not reflect changes in map. Number of Points are same across all layers. only attribute value is different.
please advise.
thansk in advance.
This implementation is not time aware, but, looking back at the code, you can update the weight of a HeatMapPoint based on a feature attribute and that will do it for you - a bit of a hack - but will work - this code is a bit outdated :-( you might be interested in the latest at https://github.com/Esri/thematic-widget-flex
Post a Comment