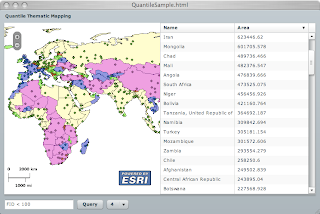
symbolFunction property of a graphic layer, however this function is called on each graphic feature and does not have a "grand picture" of the full set. This is the case of a quantile distribution, where the features are rank-ordered and equal number of features are placed in colored bucket. Here is the result: Each country is color coded based on a quantile distribution of its area property over a specified number of classes. Here is the code:
<?xml version="1.0" encoding="utf-8"?>
<mx:Application
xmlns:mx="http://www.adobe.com/2006/mxml"
xmlns:esri="http://www.esri.com/2008/ags"
xmlns:sample="com.esri.ags.sample.*"
layout="absolute"
>
<sample:QuantileAreaCalculator
    numClasses="{numClasses.value as Number}"
    graphicProvider="{queryTask.executeLastResult.features}"/>
<esri:QueryTask id="queryTask" url="http://tejas:8399/arcgis/rest/services/maps/world/MapServer/1">
  <esri:Query id="query" returnGeometry="true" where="{where.text}">
      <esri:outFields>
          <mx:String>*</mx:String>
      </esri:outFields>
  </esri:Query>
</esri:QueryTask>
<mx:Panel width="100%" height="100%" title="Quantile Thematic Mapping">
  <mx:HBox width="100%" height="100%" horizontalGap="0">
    <esri:Map id="map">
      <esri:ArcGISDynamicMapServiceLayer
        url="http://tejas:8399/arcgis/rest/services/maps/world/MapServer"/>
      <esri:GraphicsLayer id="graphicsLayer"
          graphicProvider="{queryTask.executeLastResult.features}">
      </esri:GraphicsLayer>
    </esri:Map>
    <mx:DataGrid dataProvider="{queryTask.executeLastResult.attributes}" width="100%" height="100%">
        <mx:columns>
            <mx:DataGridColumn headerText="Name" dataField="NAME"/>
            <mx:DataGridColumn headerText="Area" dataField="AREA"/>
        </mx:columns>
    </mx:DataGrid>
  </mx:HBox>
  <mx:ControlBar>
    <mx:TextInput id="where" text="FID < 10"/>
    <mx:Button label="Query" click="queryTask.execute()"/>
    <mx:ComboBox id="numClasses">
        <mx:ArrayCollection>
            <mx:Number>2</mx:Number>
            <mx:Number>3</mx:Number>
            <mx:Number>4</mx:Number>
            <mx:Number>5</mx:Number>
        </mx:ArrayCollection>
    </mx:ComboBox>
  </mx:ControlBar>
</mx:Panel>
</mx:Application>
I introduced the
QuantileAreaCalculator Class that intercepts the query last result and performs a quantile distribution of the features. A graphic feature is assigned to a bucket, and is assigned the symbol associated with that bucket.That last assignment forces the graphic to redraw itself. Thus the above result.
The
QuantileAreaCalculator numClasses property is bound to the numClasses combo box value, where upon a value change, the distribution is recalculated and the layer is auto refreshed. Download the full source code from here.
4 comments:
Hi there,
Is there an available ESRI online services similar to the one you have used in this sample? I can´t access the tejas:8399 server...
Otherwise, could you tell me how do I implement QueryLayer operation support in my services?
Thanks in advance,
Alessandro
tejas is _my_ own internal ArcGIS server. Not sure what is online - check out http://resources.esri.com/arcgisonlineservices/. Hope that helps.
I'm having issues with the com.esri.ags.sample line finding the QuantileAreaCalculator, any help?
Sorry for the delay - what is the problem ?
Post a Comment