Posts

Showing posts from 2017

On Machine Learning and General Path Recognition

Image
This is part II of my journey back into SOMs . Actually this journey started with the below picture: It is a map of AIS broadcast points around the harbor of Miami, FL. Now we, sentient creatures, when we look at this map we can quickly and clearly see patterns formed by the points. There is a sequence of points that start from the harbor and go northeast.  There is a sequence of points that starts at the harbor and go south southeast. And there are a plenty of north south paths, some are very close to the shore, others are on the "edge" to the east. And there are path in the "middle". Wouldn't it be wonderful if the Machine can see these pattern and formulate the general paths? That is actually what started this journey. I needed an unsupervised way for the Machine to recognize the patterns and emit the paths. I'm sure there are multiple ways to solve this, but I remembered that a while back I used Self Organizing Maps due to their simplicity and cruci...

On Machine Learning with Self Organizing Maps

Image
Self Organizing Map ( SOM ) is a form of Artificial Neural Network (ANN) belonging to a class of Machine Learning. AI Junkie has a GREAT tutorial about it. What I like about SOMs is that they belong to a class of unsupervised learning models and they hold true to the first law of geography. "E verything is related to everything else, but near things are more related than distant things. " - Tobler I encountered them and used them over 20 years ago, and since AI/ML is the hottest topic these days, I'm reacquainting myself with them. There are plenty of SOM libraries, but I learn (or in this case re-learn) by doing.   This project is my learning journey in implementing SOMs and " Sparkyfing " them. The following is a sample output of the obligatory RGB classifier, where a million random RGB triples are organized by a Spark based SOM into a 10x10 square lattice: And the following is a sample solution to a TSP using SOM: Like usual, all the source code ...

ArcGIS, Spark and Alluxio Integration

Image
There exist a plethora of backend distributed data stores. I am always using S3 or Hadoop HDFS or OpenStack Swift with my GIS applications to read from these backends geospatial data or to save into these backends my data. Some of these distributed data stores are not natively supported by the ArcGIS platform . However, the platform can be extended with ArcPy to handle these situations. Depending on the data store, I will have to use a different API (mostly Python based) to read and write geospatial information. This is where Alluxio comes in very handy. It provides an abstract layer between the application and the data store and (here is the best part), it caches this information in memory in a distributed and resilient-to-failure manner. So, at the application level, the code to access the data is invariant. On the backend, I can configure Alluxio to use either S3, HDFS or SWIFT. Finally, the advent of a REST endpoint in Alluxio eases the integration with ArcGIS to write, read ...

ArcGIS, Spark & MemSQL Integration

Image
Just got back from the fantastic Strata + Hadoop 2017 conference where the topics ranged from BigData, Spark to lots of AI/ML and not so much on Hadoop explicitly, at least not in the sessions that I attended. I think that is why the conference is renamed Strata + Data from now on as there is more to Hadoop in BigData. While strolling the exhibition hall, I walked into the booth of our friends at MemSQL and got a BIG hug from Gary . We reminisced about our co-presentations at various conferences regarding the integration of ArcGIS and MemSQL as they natively support geospatial types. This post is a refresher on the integration with a "modern" twist, where we are using the Spark Connector to ETL geo spatial data into MemSQL in a Docker container. To view the bulk loaded data, ArcGIS Pro is extended with an ArcPy toolbox to query MemSQL, aggregate and view the result set of features on a map. Like usual, all the source code can be found here

GeoBinning On IBM Bluemix Spark

Image
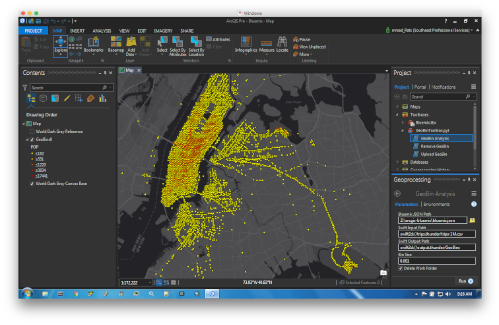
This is a proof of concept project to enable ArcGIS Pro to invoke a Spark based geo analytics on IBM Bluemix and view the result of the analysis as features in a map. Check out the source code here

Space Time Ripples

Image
Start by looking at this application and that one. Make sure to tilt the map by holding down the right mouse button and sliding the mouse up. Then, slide the bottom slider back and forth to see the data "ripple" through time. This type of visualization is something I have wanted to do for a long time and is now possible with the advent of the new 4.2 ArcGIS API for JavaScript . The new API has "hooks" to enable a developer to invoke WebGL shaders directly, which can render a massive amount of data very efficiently and very quickly. The authoring of the data for the above applications is based on ArcGIS Pro extended with a custom ArcPy based toolbox. The tool queries features from a user selected feature class, bins the features by space and time and emits a space-time "cube" in the form of a Dojo AMD module to be loaded by a JavaScript application. The source of the feature class can be a geodatabase, a relational data store, or the new Spatia...